A Summary Of The IPCC Report - The Physical Science Basis Of Climate Change
This report continues from the fifth assessment report of
2013 on the same. It has been arrived at using new climate models and methods,
increased knowledge of the workings of the climate system, and palaeodata in
order to have considerably more accurate results. To start, the notable surge
in greenhouse gas concentrations from 1750 to today is from human influence.
Measurements puts carbon dioxide at 410 parts per million (ppm) each year,
methane at 1866 parts per billion (ppb), nitrous oxide at 332 ppb, perfluorocarbons
at 109 parts per trillion (ppt), sulphur hexafluoride at 10 ppt, nitrogen
trifluoride at 2 ppt and hydrofluorocarbons at 237 ppt. The natural carbon
sinks of land and water remove a continuous 56% of carbon emissions from the
air every year for the last sixty years and this depending on the region.
For the last 40 years, each 10 years have been warmer than
the preceding ten, noted against a baseline of 1850. From 2001-2020 global
surface temperatures were 0.99 (0.84-1.10) higher than 1850-1900. Land
continues to heat up faster than the ocean. The range of temperatures spike
from 1850-1900 to 2010-2019 is 1.07 degrees. Finely blended greenhouse gases
are the cause of tropospheric warming as from 1979, while human-triggered ozone
depletion is what has caused stratospheric cooling between 1979 to the 1990s.
Natural drivers, internal variability and aerosols have a slight influence on
temperatures.
Anthropogenic influence on climate has resulted in an
increase in worldwide precipitation volumes since 1950, something that
accelerated since 1980. Concurrently, there’s been changes in near surface
ocean salinity (sea’s more salty), and the range of mid latitude storms is
headed towards the poles. In the Southern Hemisphere, extra tropical jets are
moving pole wards during austral summer.
Human influence has caused worldwide retreat of glaciers
noted from the 1990s, while Arctic sea ice has also declined from 1979-2019. In
fact two-fifths (40%) of this North Pole ice is lost in September and a tenth
(10%) is lost in March. The human footprint on climate has caused loss of
spring snow cover by half as from mid-20th century (1950). The
Greenland ice sheet has also been melting (losing volume) for the last 20 years.
 |
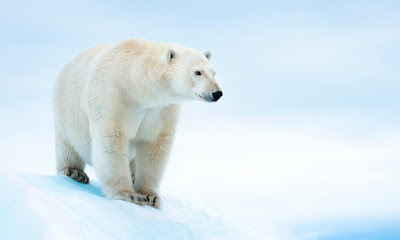
| A polar bear - image by WWF |
The first 700 meters of the ocean have warmed since 1970
while the open ocean has become more acidic. Oxygen levels in the upper ocean
have declined in a sustained manner since 1950. This is the result of heightened
greenhouse gas emissions and human impact on climate.
Sea level has risen by 0.20 meters from 1901-2018 while
climate zones are migrating towards the South and North poles. The growing
season now has an additional two days every decade in the Northern hemisphere extra
tropics. The climate system is witnessing changes that have never occurred
before for hundreds to thousands of years. In 2019, carbon levels in the air
were higher than the last 2 million years while methane and nitrous oxide
registered levels last seen 800,000 years ago. Since 1750, CO2 concentrations
have shot up by 47% and CH4 (methane) by 156% which is higher than any changes
witnessed during normal changes between consecutive millennia for the last
800,000 years. The current level of nitrous oxide at 23% mimics what occurs
during this multimillenial intervals.
Global temperatures have risen quicker since 1970 than any
other 50 year interval for the preceding 2000 years. The 2011-2020 period has
been warmer than the most recent warm multi-century period which is 6500 years
ago and before that 125,000 years ago.
2011 to 2020 has witnessed the lowest mean Arctic sea ice from
1850. The area occupied by late summer Arctic sea ice is the smallest in 1000
years at the least. Global melting of glaciers (retreat) has never been seen
before for the last 2000 years.
Sea level on a global scale since 1900 has been rising
faster than any 100 years for the past 3000 years. The ocean has been warming
quicker than the last deglacial shift which was 14000 years ago. The ocean pH
has decreased (low) to levels unseen for 2 million years.
Heatwaves have become more frequent and stronger over land
since 1950, while coldwaves have decreased in strength and frequency. Since the
1980s, marine heatwaves are now twice the number. This can be attributed to
human caused climate change. Incidence of heavy rain has increased over many
terrestrial areas and agricultural and ecological droughts have become more
common because of increased evapotranspiration. The monsoon over parts of Asia
and Africa has brought more intense rain.
Tropical cyclones (category 3-5) have become more and
stronger in the last 40 years, and have also shifted in a Northward direction.
Compound events i.e. climate events occurring simultaneously, have also
increased. Droughts and heatwaves, fire weather (windy, hot and dry) and
flooding has been witnessed in all continents at an increasing rate. Therefore
human caused climate change is being witnessed throughout the world.
The report gives a ‘best estimate’ climate equilibrium
sensitivity of 3 degrees, with a range of 2.5 -4 degrees.
The human impact on the climate system has added an extra
amount of energy into the climate system some of which is lost to space. Of
this oceans consist of 91%, land (5%), ice loss (3%), atmospheric warming of
1%.
Heating has caused sea levels to rise because of thermal
expansion of ocean water and ice loss. Ice sheet loss has been 4 times more
between 1992 and 2019.
This report has indicated five scenarios about the future.
The very low (SSP1-1.9) and low scenarios (1-2.6)where carbon emissions reach net
zero at 2050 then net negative methods are employed at different scales. The
intermediate case (SSP2-4.5) with current emission levels remaining constant,
and high (SSP3-7.0) and very high (SSP 8.5) where current carbon emissions
double by 2100 and 2050 respectively.
Under all scenarios, global temperatures increase until the
middle of the century. 1.5 and 2 degrees thresholds are both reached and
exceeded this century unless deep reductions in all greenhouse gases are
effectuated in the near future.
In comparison to 1850-1900, temperatures between 2081-2100
(long-term) will be higher by 1.0-1.8 degrees in the lowest charted trajectory
(scenario) and 3.3-5.7 degrees in the highest scenario. The last time
temperatures hit 2.5 degrees was 3 million years in the past.
In the high, very high and intermediate cases, 2 degrees is
attained between 2041 and 2060 (midterm) and thereafter exceeded. The very and
low scenarios don’t allow for warming beyond 2 degrees this century. 1.5
degrees is attained under the higher three scenarios between 2021-2040
(near-term). This threshold is overshot under all scenarios except in the case
of the very low emissions trajectory. Under this one, planetary temperatures
fall back under 1.5 degrees by 2100 though they might momentarily exceed this
figure first.
All this noted, global temperatures can variably reach 1.5
or 2 degrees on a given year but this does not automatically equal these
thresholds being attained globally for the long term.
Now, the hotter it becomes, the more climate impacts become
multiplied. Terrestrial regions warm up 1.4-1.7 times more than the ocean while
the Arctic is double the rate of average global warming. Each additional
increase of warming causes clear and heavier, more intense and frequent heatwaves,
drought, rain and flooding, cyclones etc.
Each 0.5 degrees of added warming causes evidently visible
and marked climate and weather extremes. Rare events become frequent and
common. Never seen before events (unprecedented) happen at 1.5 degrees. The semi-arid,
mid latitude and South American monsoon regions experience hotter days which
are 1.5-2 times the global rate. Arctic coldest days heat up three times more
and marine heatwaves intensify and become more common with more warming, this
particularly in the Tropical Ocean and Arctic.
With every 1 degree increase, extreme daily rain is 7% more,
there’s more intense rain globally. Tropical cyclones reach category 4-5 with
intense and faster peak winds. Increasing warming causes permafrost thaw, loss
of seasonal ice cover and loss of Arctic sea and land ice. In fact, under all
five emissions scenarios, the Arctic is sea ice free in September once by mid-21st
century. This increases in pace under additional warming. Surface soil moisture
and soil column moisture also decreases.
Continued global warming further magnifies and makes extreme
the water cycle, including the global monsoon, and the severity of wet and dry
seasons and events. With rising temperatures the rain and surface water flows
become more variable on a seasonal and annual basis. Precipitation over land
intensifies under all five emission pictures, and increases over the high
latitudes, equatorial pacific and monsoon regions but falls back over the
subtropics and tropics.
Snow melts earlier in spring with peak flow attained in this
season leading to water shortages in summer, and more snow volumes are
converted to rain instead.
Warming means extremes of either very hot times (droughts)
or very wet events (floods) though the intensity and location will depend on
regional characteristics. The El Nino Southern Oscillation increases in the
last half of the century in the highest three emission scenarios. The monsoon
in the mid to long term is heavier over the Asia and Africa continents except
the farthest west regions of the Sahel. There is delayed onset and retreat of
the same over some areas.
Storms shift towards the South Pole bringing heavier rain in
the long-term under higher greenhouse gas emission scenarios.
Higher carbon emissions will consequently lower the capacity
of land and sea to remove accumulation of atmospheric emissions and act as a
sink. In the intermediate scenario, where current emission levels remain
constant, the amounts of carbon removed by the two sinks decline after
midcentury. If net negative carbon dioxide removal is not deployed, both sinks
start becoming sources of carbon by 2100.
With higher emissions, feedbacks between the carbon cycle
and climate change increase and tipping points can be reached. Permafrost thaw,
forest dieback, wildfires and wetlands producing methane and carbon dioxide all
start emitting more carbon into the air.
Majority of changes are irreversible because of past and
future emissions particularly for ice sheets, ocean and sea level rise. In fact
emissions since 1750 will continue to impact the ocean, causing more warming,
de-oxygenation and stratification though the rate depends on future emissions.
A lot of these changes are irreversible for hundreds to thousands of years
(centuries to millennia).
Both mountain and polar glaciers continue to melt for
decades to centuries, loss of permafrost carbon due to thawing is irreversible
in century-wide (centennial) scales, the Greenland ice sheet loses volume
continually. Sea level rise continues throughout this century and for millennia
due to deep ocean warming and ice sheet loss. For the next 2000 years, under
1.5 degrees it is 2-3 meters, under 2 degree it is 2-6 meters and 5 degrees
sees 19-22 meters rise.
Now, natural drivers and internal variability have modified
the role of human influence on climate in the short term and regionally but has
not affected long term warming trends.
Solar radiation and volcanic eruptions have slightly
modified human caused climate change by covering up or enhancing the
phenomenon. Climate effects can be affected by internal variability e.g. causing
near term cooling, something which can also be caused by aerosols.
One volcanic eruption is expected this century and will
cause short term cooling (for 3 years at most) and alter the monsoon
temporarily.
Further global warming can bring concurrent compound events
e.g. rain and flooding, drought and heatwaves, hot and wet extremes happening
at the same time. Additionally there’ll be more hot events and climate markers
(drivers) than cold ones. This is more pronounced at 2 degrees than at 1.5.
Incidence of heavy rain and agricultural and ecological
droughts on a global scale increase. Sea level rise becomes more pronounced in
two thirds of global coastline except uplifted areas. Tropical cyclones increase
in number and strength, this happening at 1.5 then at 2 degrees. Cities which
amplify warming by the urban heat island effect face the brunt of heavy rain
and runoff.
Rare events, low likelihood but high impact events become
more frequent if a certain threshold of emissions is reached. Abrupt climate
change and tipping points can be reached. These events which were very rare in
the past become more and have a larger geographical scale.
Now to stop future climate change, net zero (for carbon)
needs to be reached as quick as possible. Other greenhouse gas emissions need
to be cut, aerosol production cut (improves air quality) and accumulated emissions
of carbon in the air have to be removed through engineered carbon dioxide
removal (CDR).
A gigaton of carbon dioxide causes 0.27-0.63 degrees
increase in temperature, so CDR can be deployed here. These methods need
regulation because of their effects on land, water, biodiversity and
agriculture. Human controlled CDR can help reverse ocean acidification and
lower temperatures but other climate effects like se level rise continue.
Reductions of methane and aerosols improve air quality and
balance each other out by cancelling the warming and cooling effect
respectively.
Under the low and very low emissions scenarios, air quality
improves and changes in temperatures are noticeable in 20 years. However these
reductions do not meet the recommended cuts needed to keep air healthy and
pollution-free.
Both scenarios will have a positive impact on climate change
but the results might be concealed for some time by natural variability.


Comments
Post a Comment